
Part 1 of 7 · Series index · Next: Throughput & scaling →

Part 1 of a series. This post has no throughput charts — on purpose. Before I show you a single number, I want to show you the traps that make most in-memory benchmarks lie, and exactly how I disarmed each one. If the method isn't fair, the numbers aren't worth reading.
The uncomfortable truth about database benchmarks
Almost every "X is 25× faster than Y" benchmark you've seen is rigged — usually not maliciously, just carelessly. The author picks a setup that happens to flatter one engine, runs it once, and publishes the number. The most common way it goes wrong is subtle: the benchmark measures the client, or the virtual machine, or a cache-miss path — anything except the database it claims to measure.
So when the DragonflyDB team reached out with notes on how to benchmark Dragonfly fairly, I took it as a challenge to do this properly — and to publish my methodology before my results, so you can attack the method first.
Here's the question I'm actually answering:
On one server, using all its CPU cores, how much load can each engine sustain — and what does each one cost you in operational complexity to get there?
That "one server, all cores" framing matters, and it's where the first trap hides.
Trap 1: "single process vs single process" is not the fair fight
Redis executes commands on one thread. Since Redis 6 it can use extra threads for network I/O, but the actual data work — the part that matters — still runs on a single core. Valkey is the same shape. Dragonfly, by contrast, is multi-threaded by design: one process that uses every core you give it.
So if I put one Dragonfly process (48 cores) next to one Redis process (1 core of real work) and shout "Dragonfly wins!", I've told you nothing except that 48 > 1. That's the rigged benchmark I refuse to publish.
To use all the cores of one box, Redis has to be sharded into a cluster — many redis-server processes on the same machine, each owning a slice of the keyspace. So the fair fight is:
- one Dragonfly process (uses the whole box), versus
- a Redis/Valkey cluster of N shards (also uses the whole box).
Same machine. Same cores. Same goal: saturate the node. That's apples to apples. Single-process Redis stays in my tests only as a labelled baseline, never as the comparison.
Trap 2: how many shards? (the small version of the big trap)
Once you agree the fair peer is a Redis cluster, a new question appears: how many shards? Too few and Redis can't use the cores; too many and they thrash. Rather than guess, I swept shard counts — and one shard per physical core turned out to be about right on this hardware.
That was the easy version. The nasty one was realising I couldn't even drive the cluster hard enough to measure it. To read any database's true speed, you have to push enough load that the database is the bottleneck — not your test tool. But a cluster is many independent shards, and to see its real ceiling you have to keep every shard busy at once. A normal load tool routes every request from a single process, and that routing work pins the tool's own CPU long before the shards are busy — so my first cluster runs measured my load generator, not the cluster, with the shards sitting ~16% idle. That's the trap that nearly wrecked the whole benchmark, and it gets its own post.
Trap 3: the client was the real bottleneck
This is the big one, and it's why so many benchmarks are worthless.
A benchmark has two machines doing work: the database (server) and the load generator (client). Throughput is capped by whichever runs out of CPU first. If the client maxes out before the server does, then every engine flatlines at the client's ceiling — and they all look identical, even if one is twice as fast. You've benchmarked your load generator.
The fix: make the client more powerful than the server, put it on a separate machine, and then prove it wasn't the limit. My harness ramps the load up step by step and records both server and client CPU. At the throughput plateau I check who's saturated:
- server maxed, client has headroom → server-bound → the number is real.
- client maxed, server has headroom → client-bound → throw it out, get a bigger client.
If I can't show you which side was the ceiling, I won't show you the number.
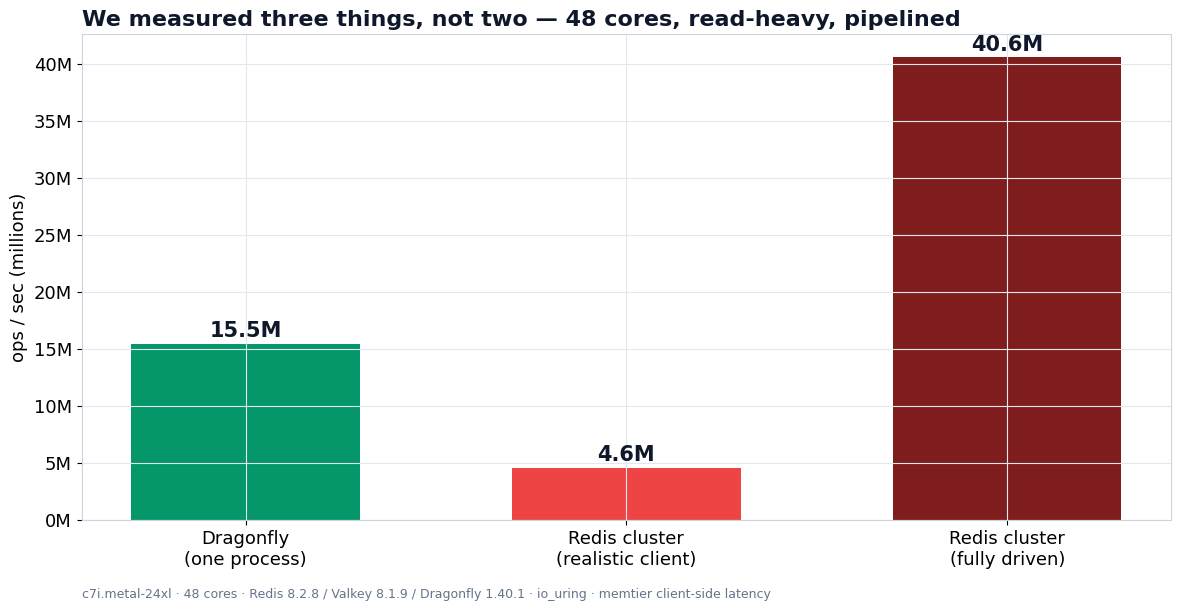
And here's where it got genuinely surprising. Even with a big, separate client, a single cluster-mode client couldn't saturate a 48-shard cluster — the shards sat ~16% busy while the client thrashed on routing. I was about to report ~4.6M ops/s as "the cluster's throughput" when the same cluster, driven correctly (one dedicated client per shard), does ~40M. Reporting either number alone is a lie: 4.6M sandbags Redis; 40M pretends everyone routes perfectly with unlimited client hardware.
So I report the cluster two ways — what a normal client actually gets, and the fully-driven ceiling — and let you see the gap. That gap turned out to be the most interesting finding in the whole study, and it gets its own post.
Trap 4: I was benchmarking cache misses
When I first ran it, ~72% of my reads were misses — I was reading random keys from a database that was mostly empty, so I was measuring the "key not found" path, which is cheaper and meaningless. Fixed by pre-loading the full keyspace before every read-heavy run. Now every run reports its hit rate, and I only trust runs where reads actually hit real data.
Keeping the engines truly identical
Small asymmetries add up, so every engine gets the exact same treatment: persistence off, identical memory limit, no eviction, same value sizes, same request mix, same pipeline depths. Where one engine needed a special flag, I applied the equivalent to all three rather than to one. And I made each engine's "no persistence, no eviction" settings explicit — verified from the docs, not assumed from defaults. Every knob a run used is recorded in the results row, so any number is fully reproducible.
A concrete example of that care, because it changed the numbers: on a fresh cloud box, Docker's default security profile silently blocked Dragonfly's io_uring and dropped it to a slower I/O path — which would have quietly handicapped Dragonfly. I gave it back its native io_uring (Redis and Valkey use their native epoll), so each engine runs on its own best path rather than one being crippled by an environment quirk. That's the difference between a fair test and an accidental hit piece.
The honesty guard I'll hold all series long
It would be easy — and wrong — to claim "Dragonfly has no sharding limitations." It does. Dragonfly Cluster, once you scale it across machines, uses the same 16,384-hash-slot model as Redis and hits the same limits. Dragonfly's real advantage is narrower and more honest:
To make Redis use your whole server you must cluster it, and clustering costs you cross-key freedom. Dragonfly gives you the cores without that cost — so you postpone clustering until you truly outgrow one big machine.
Not "never." Later. That's the claim, and I'll keep it precise even when a punchier overstatement would get more clicks.
What one laptop can and can't tell you
I built and validated the whole harness on a laptop — but I won't publish speed numbers from it, and you should distrust anyone who does. Under a virtual machine, CPU pinning isn't real, cores aren't uniform, and the hypervisor injects timing noise. My own ramp test proved it: at the throughput plateau, neither the server nor the client was CPU-saturated — the ceiling was the virtualization layer itself.
So the split is:
- Hardware-independent results (how the engines behave — cross-slot rules, memory-per-key) I can and will show from anywhere.
- Performance results (throughput, latency, scaling) come only from bare metal: an AWS
c7i.metal-24xlserver (48 physical Sapphire Rapids cores, no hypervisor), a separate over-provisionedc7i.24xlargeclient, same availability zone and placement group — real cores, real pinning, a network I control. That's the setup the next posts run on.
What's coming
- Throughput per node — the fair fight, across read/write mixes and pipeline depths.
- Core scaling — what happens from 4 to 48 cores.
- Latency under load — the tail (p99, p99.9), not just averages.
- Memory efficiency — bytes per key.
- Operational simplicity — cross-slot, hash tags, Lua and transactions: the real cost of a cluster.
- When to use which — a decision guide, because (spoiler) there is no universal winner.
The full harness — scripts, pinned versions, raw results — will be public, so you can rerun everything and check my work. That's the whole point.
Next: the throughput numbers, on real hardware, with the receipts.
About the author
I'm Sunny Sahijwani — a senior backend & DevOps engineer.
👉 Connect with me on LinkedIn — I'm always happy to talk in-memory databases, performance, and systems architecture.
The full harness, pinned versions, and raw data for this benchmark are public on GitHub — rerun it and tell me where I'm wrong.