
Part 3 of 7 · ← Throughput & scaling · Next: Latency under load →

Part 3. This is the post I didn't expect to write. It started as a bug in my benchmark and turned into the most interesting finding of the whole project — about how hard it actually is to use a Redis Cluster's throughput, and why most cluster benchmarks (mine included, at first) quietly under-report it.
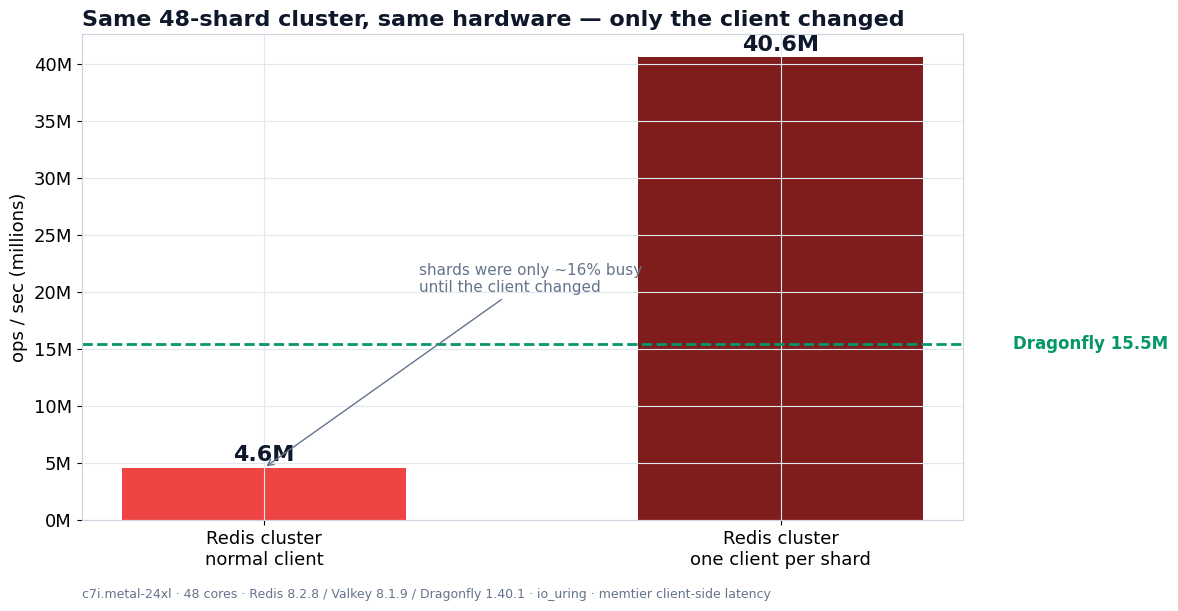
In Part 2 I showed two very different numbers for the same 48-shard Redis cluster on the same hardware: 4.6M ops/s with a normal client, 40.6M driven perfectly. This post is how I found that gap, and what it means. It's a debugging story, because that's what it was.
The smell: a 4-shard cluster tied a 48-shard cluster
My first cluster numbers looked wrong. I ran a quick check — does throughput improve as I add shards? — and got this (read-heavy, pipeline 16):
- 24 shards: 2.65M ops/s
- 48 shards: 2.66M ops/s
Identical. Doubling the shards did nothing. That's not how a cluster is supposed to behave — 48 single-threaded shards should crush 24. Something was capping throughput before the shards even got busy.
The tell: the shards were idle
So I measured CPU on both boxes during the run. The server, running all 48 shards, was at 779% of 4800% — about 16% busy. The shards were mostly asleep. Meanwhile the client's load-generator threads were pinned at ~100%.
That's the signature of a client-side bottleneck: the cluster had tons of spare capacity, but the client couldn't feed it. And counter-intuitively, adding more client threads made it worse (4.3M → 3.0M) — the classic sign of lock contention inside a single process.
The proof: one shard can do 474K/sec on its own
To find out how much the cluster should be able to do, I measured one standalone Redis shard, pinned to one core, driven directly:
474,000 ops/s at 100% CPU — one core, fully saturated.
So the math on a 48-core box is brutal: 48 × 474K ≈ 22.8M ops/s of raw capacity (and in practice, driven well, each shard did even more — the cluster topped out near 40M). I was extracting ~4.3M. I was using less than a fifth of what the cluster could do, and no amount of tuning the single client fixed it.
The cause: cluster-mode routing, in one process, doesn't pipeline
Here's the mechanism, and it's worth understanding because it affects real applications, not just benchmarks.
A Redis Cluster client has to route every key to the shard that owns its hash slot (slot = CRC16(key) mod 16384). A single-process cluster client (like memtier's --cluster-mode) does this routing on the client side, and two things go wrong under load:
- Pipelining fragments. Pipelining is fast because you batch many requests down one connection before waiting for replies. But in a cluster, consecutive random keys go to different shards — so a batch of 16 gets split across 16 connections, one request each. The single most important throughput lever (deep pipelines) collapses to depth ~1.
- One process, one routing bottleneck. All that per-key CRC16 + connection-selection happens in one process's threads, which contend. Adding threads adds contention, not throughput.
The result: the client saturates itself doing routing bookkeeping while the shards sit idle. 4.3M, and the cluster barely breaks a sweat.
The fix: one client per shard, pinned by hash-tag
If the problem is "one client can't route to 48 shards efficiently," the fix is to stop routing. I gave each shard its own dedicated memtier process, connected directly to that shard's port (no cluster-mode), using keys with a hash-tag ({tag}:...) chosen so every key hashes to that shard's slots. Now each shard gets a single, dedicated, fully-pipelined stream — exactly like the standalone-shard test that hit 474K.
The result, 48 shards, summed:
39.8M ops/s, server at 91% CPU — near-saturated.
From 4.3M to 39.8M by changing only the client, not the cluster. The cluster was never the bottleneck. The client's ability to route was.
(For the curious: mapping tags to shards is deterministic — I query CLUSTER NODES for each shard's slot range, then pick a hash-tag whose CRC16 mod 16384 lands in it. The tool that does this is in the repo.)
Why this matters beyond benchmarking
This isn't a benchmark artifact — it's a real property of Redis Cluster, and it cuts two ways:
For benchmarks: any Redis Cluster number produced by a single cluster-mode client is probably under-reported — often massively. If you see a cluster benchmark and the shards weren't near 100% CPU, treat the number as a lower bound. (This is exactly why I report two cluster numbers.)
For production — this is the important part: reaching a cluster's throughput ceiling requires client-side routing that actually pipelines per-shard, plus enough client capacity to drive every shard. Good cluster client libraries do route client-side — but:
- your client fleet has to be large enough to keep 48 shards busy (in my test, saturating the cluster took a client as powerful as the server), and
- pipelining/batching only helps if your keys co-locate per shard — random-key workloads fragment it.
So the cluster's 40M ceiling is real, but it comes with a bill: serious client-side engineering and client hardware. Dragonfly's 15.5M comes with a one-line client and no routing to think about. That's the trade — and now it's not hand-waving, it's a factor of ~9 between "cluster, naively driven" and "cluster, perfectly driven," with the truth for most teams sitting closer to the naive end.
The honest caveat
The "realistic" number (4.6M) reflects one specific normal client (memtier cluster-mode) under a heavy pipelined load. A production app with a good client library and a modest request rate won't hit memtier's exact contention — but it also won't reach the 40M ceiling without real effort. The shape is what's robust: a cluster's usable throughput depends enormously on client-side routing quality and client capacity, in a way a single process like Dragonfly simply sidesteps.
Next
Part 4: latency under load — where this same client-bottleneck effect shows up dramatically in the tail (a naive cluster client sat at p99 ≈ 138ms while Dragonfly held 2.4ms), and how to read that honestly.
Full harness, the per-shard saturation tool, and raw data are public. Verified against the DragonflyDB team's notes before publishing.
About the author
I'm Sunny Sahijwani — a senior backend & DevOps engineer.
👉 Connect with me on LinkedIn — I'm always happy to talk in-memory databases, performance, and systems architecture.
The full harness, pinned versions, and raw data for this benchmark are public on GitHub — rerun it and tell me where I'm wrong.