
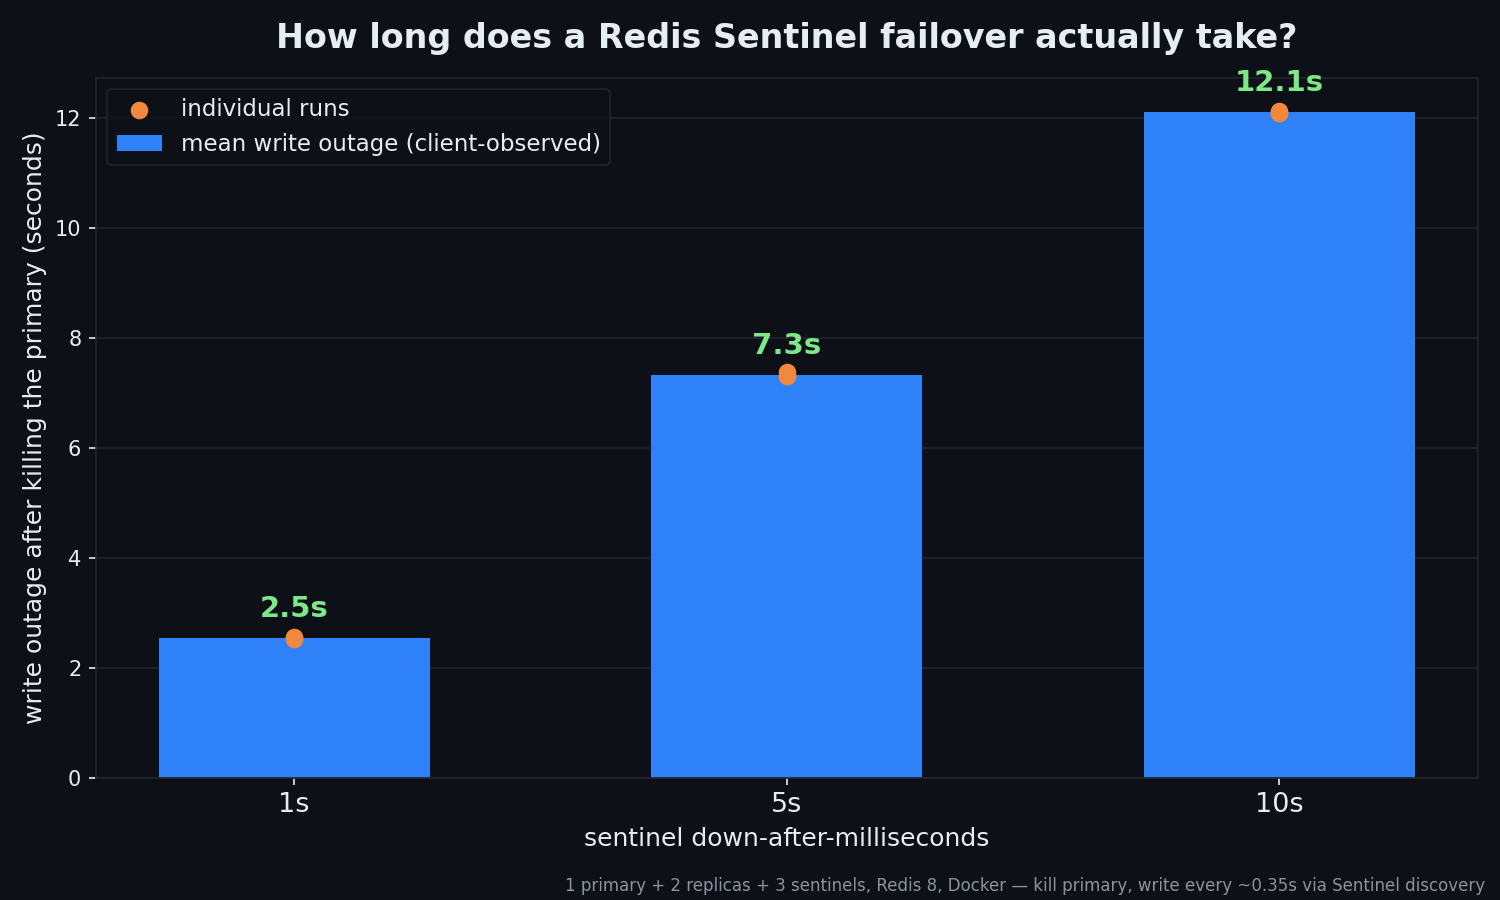
I killed an in-memory database primary on purpose — fifteen times, across three down-after-milliseconds settings and three engines (Redis 8, Valkey 8, Dragonfly) — and timed how long writes actually fail before a replica takes over. Short answer: your failover window is roughly down-after plus about two seconds of election and promotion — and it's the same no matter which engine is dying. Here's the runnable lab, the numbers, and the traps that bite in production.
The answer up front
On a 1-primary / 2-replica / 3-sentinel setup (Redis 8, Docker), measured as the gap between killing the primary and the first successful write on the promoted replica:
down-after-milliseconds |
write outage (mean of 3 runs) | individual runs |
|---|---|---|
| 1000 (1s) | 2.5s | 2.52 / 2.54 / 2.56 |
| 5000 (5s, a common default) | 7.3s | 7.30 / 7.37 / 7.31 |
| 10000 (10s) | 12.1s | 12.09 / 12.12 / 12.09 |
The relationship is almost boringly linear: outage ≈ down-after + ~2s of quorum vote, leader election, and replica promotion. That overhead is the fixed cost; down-after is the dial you control. Nobody tunes it, and it's the single biggest factor in how long your app stares at a dead Redis.
And before you ask whether a different engine would fail over faster: I reran the same kill against Valkey 8 and Dragonfly under identical sentinels — at down-after=5s all three came back in 7.3–7.4s. The outage belongs to Sentinel, not to the engine — full table further down.
Everything below is reproducible — the lab, the kill script, and the sweep that produced this table are on GitHub: github.com/sunnysahijwani/redis-sentinel-failover-lab. docker compose up and kill the primary yourself.
The problem nobody notices until 3am
Here's a setup I see constantly. A Laravel app scaled across several web servers — three, five, ten app instances behind a load balancer. Feels highly available. But every one of those app servers talks to one Redis: cache, sessions, and the Horizon queue all live there.
That single Redis is a single point of failure hiding in plain sight. When it dies — OOM, a kernel panic, someone reboots the wrong box — it doesn't take down one app server. It takes down the shared state behind all of them at once:
- Cache goes cold. Every request that used to hit Redis now hammers the database — a cache stampede right when you can least afford it.
- Sessions vanish. Everyone's logged out.
- The queue stops. Horizon can't read or write jobs; background work stalls.
Adding more app servers does nothing for this. The fix isn't more app servers — it's making Redis itself survive the loss of a node. That's what Redis Sentinel does, and this article is a working lab that proves it — with a stopwatch on it.
The options, briefly
There are three honest ways to get Redis high availability:
- Redis Sentinel — you keep one primary and one or more replicas. A small quorum of "sentinel" processes watches the primary, and when it dies, they vote, pick the healthiest replica, and promote it to primary automatically. Your clients get pointed at the new primary. This is the standard answer for an app that fits on one node's worth of RAM (i.e. most apps).
- Redis Cluster — shards your keyspace across multiple primaries, each with its own replica, with failover built in. You reach for this when your data or write throughput is too big for a single node. More moving parts — I've written about what cluster mode actually costs you operationally.
- Managed (AWS ElastiCache, managed Valkey, etc.) — someone else runs the failover for you. Great, until you want to understand what you're paying for — which is exactly why building it once yourself is worth an afternoon.
We're centering on Sentinel, because it's the right tool for the non-sharded, multi-instance Laravel case, and because it's the one you can genuinely understand end to end.
How Sentinel works, in plain language
Four ideas and you've got it:
- Monitoring. Each sentinel pings the primary continuously. If the primary doesn't answer for
down-after-milliseconds, that sentinel subjectively marks it down. - Quorum. One sentinel's opinion isn't enough — that's how you'd get false alarms from a brief network blip. A configured number of sentinels (the quorum) must agree the primary is down before anything happens. This is why you run an odd number of them, typically 3 or 5.
- Election & promotion. Once quorum agrees, the sentinels elect a leader among themselves, the leader picks the most up-to-date replica, and promotes it with
REPLICAOF NO ONE. The other replicas are repointed at the new primary. - Client redirection. Your app doesn't hardcode the primary's address. It asks a sentinel "who is the master right now?" and connects to whatever it's told — so after a failover, it simply reconnects to the new one.
That last point is the one people miss: if your client points at a fixed IP, none of this helps you. The client has to be Sentinel-aware.
The lab: 1 primary + 2 replicas + 3 sentinels
Everything below is self-contained Docker. It touches nothing else on your machine, exposes no host ports, and cleans up completely.
docker-compose.yml
services:
  redis-primary:
    image: redis:8
    container_name: redis-primary
    command: redis-server --save "" --appendonly no --maxmemory-policy noeviction
    networks:
      redisnet:
        ipv4_address: 172.28.0.10

  redis-replica-1:
    image: redis:8
    container_name: redis-replica-1
    command: redis-server --save "" --appendonly no --maxmemory-policy noeviction
             --replicaof 172.28.0.10 6379 --replica-announce-ip 172.28.0.11
    depends_on: [redis-primary]
    networks:
      redisnet:
        ipv4_address: 172.28.0.11

  redis-replica-2:
    image: redis:8
    container_name: redis-replica-2
    command: redis-server --save "" --appendonly no --maxmemory-policy noeviction
             --replicaof 172.28.0.10 6379 --replica-announce-ip 172.28.0.12
    depends_on: [redis-primary]
    networks:
      redisnet:
        ipv4_address: 172.28.0.12

  redis-sentinel-1: &sentinel
    image: redis:8
    container_name: redis-sentinel-1
    command:
      - sh
      - -c
      - |
        printf 'port 26379\nsentinel monitor mymaster 172.28.0.10 6379 2\nsentinel down-after-milliseconds mymaster ${DOWN_AFTER:-5000}\nsentinel failover-timeout mymaster 10000\nsentinel parallel-syncs mymaster 1\n' > /etc/sentinel.conf
        exec redis-sentinel /etc/sentinel.conf
    depends_on: [redis-primary]
    networks:
      redisnet:
        ipv4_address: 172.28.0.21

  redis-sentinel-2:
    <<: *sentinel
    container_name: redis-sentinel-2
    networks: { redisnet: { ipv4_address: 172.28.0.22 } }

  redis-sentinel-3:
    <<: *sentinel
    container_name: redis-sentinel-3
    networks: { redisnet: { ipv4_address: 172.28.0.23 } }

networks:
  redisnet:
    driver: bridge
    ipam:
      config:
        - subnet: 172.28.0.0/16
A few deliberate choices worth calling out:
- Static IPs. Sentinel identifies nodes by address. Fixed IPs make the demo deterministic and sidestep container-DNS quirks during a failover.
sentinel monitor mymaster 172.28.0.10 6379 2— watch the primary; the trailing2is the quorum (2 of 3 sentinels must agree).down-after-millisecondsis parameterised (DOWN_AFTER, default 5000) — that's the dial we're about to sweep.- Each sentinel writes its own config at boot. Sentinel rewrites its config file at runtime (to record replicas, epochs, etc.), so a shared read-only file breaks it — generating one per container in
/etcis the robust pattern.
Kill the primary and watch
The repo's failover-demo.sh starts the cluster, writes one key per second through whatever Sentinel currently calls the master, then kills the primary. This is real output, not a mock-up:
==> 💥 KILLING THE PRIMARY:  docker kill redis-primary

==> The write log across the whole event (watch the master IP change):
   [001] wrote to master 172.28.0.10  OK
   [002] wrote to master 172.28.0.10  OK
   [003] wrote to master 172.28.0.10  OK
   [004] wrote to master 172.28.0.10  OK
   [005] write FAILED  (no reachable master yet)
   [006] write FAILED  (no reachable master yet)
   [007] write FAILED  (no reachable master yet)
   [008] wrote to master 172.28.0.11  OK
   [009] wrote to master 172.28.0.11  OK
   ...
==> New master = 172.28.0.11 ; confirm it now reports role:master
role:master
connected_slaves:1
demo:counter survived = 20
Read it top to bottom and you can see the entire incident: writes flowing to the original primary, a window of failures while the primary is dead and the sentinels are voting, then writes resuming against the promoted replica with no human involved — and the data survived.
Measuring the dial nobody tunes
The demo shows failover works. The next question is the one that matters at 3am: how long is that window, and what controls it?
The controlling config is down-after-milliseconds — how long a sentinel waits for silence before declaring the primary dead. Almost every tutorial copies a value (usually 5000 or 30000) without saying what it costs. So I measured it: for each of 1s / 5s / 10s, I ran the kill three times and timed the outage a client actually observes — writes attempted roughly every 350ms through Sentinel discovery, outage = kill → first successful write on the promoted node.
Result: the outage tracks the dial almost perfectly — ~2.5s at down-after=1s, ~7.3s at 5s, ~12.1s at 10s. Your window is down-after plus a 1.5–2.3 second promotion tax.
Three things worth reading off those numbers (the cover chart up top plots them):
- The floor isn't zero. Even at
down-after=1s, you eat ~2.5s of outage. Detection is only part of the window — quorum agreement, leader election among the sentinels, and the replica's promotion are a tax of roughly 1.5–2.3s in my runs that you pay regardless. - The relationship is linear, so the trade-off is legible. Every second you add to
down-afteris a second added to every real outage — and every second you remove increases the odds a GC pause, afork()for persistence, or a brief network blip triggers a false failover. That false-positive risk is why you shouldn't just set it to 500ms and declare victory. - The variance is small. Three runs per setting landed within a tenth of a second of each other (max spread 0.07s). This is a deterministic machine, not a dice roll — which means you can actually plan around your configured window.
Method honesty, so you can attack it: this is Docker on a Mac, timed from the client side with ~0.1s of docker exec overhead per write, and failed attempts time out at 2s — so treat sub-second digits as approximate. The shape — fixed promotion overhead plus your down-after — is the durable finding, and the sweep script is in the repo so you can produce this table on your own hardware in about ten minutes.
Does the engine matter? Redis vs Valkey vs Dragonfly
There's a tempting thought hiding in that fixed ~2s tax: maybe a faster engine fails over faster. Valkey ships multithreaded I/O; Dragonfly is a from-scratch multithreaded rewrite that can be dramatically faster under load — I've benchmarked exactly that. Would either shave the outage window?
So I ran the identical experiment against all three. Same topology, same kill, and — deliberately — the same three redis:8 sentinels every time, so the only variable is the engine under them. (Valkey is a drop-in; Dragonfly officially supports Redis Sentinel as its HA mechanism.) Three runs each at down-after=5s:
| engine | write outage (3 runs) | mean |
|---|---|---|
| Redis 8 | 7.30 / 7.37 / 7.31 | 7.33s |
| Valkey 8 | 7.37 / 7.38 / 7.36 | 7.37s |
| Dragonfly | 7.33 / 7.36 / 7.43 | 7.37s |
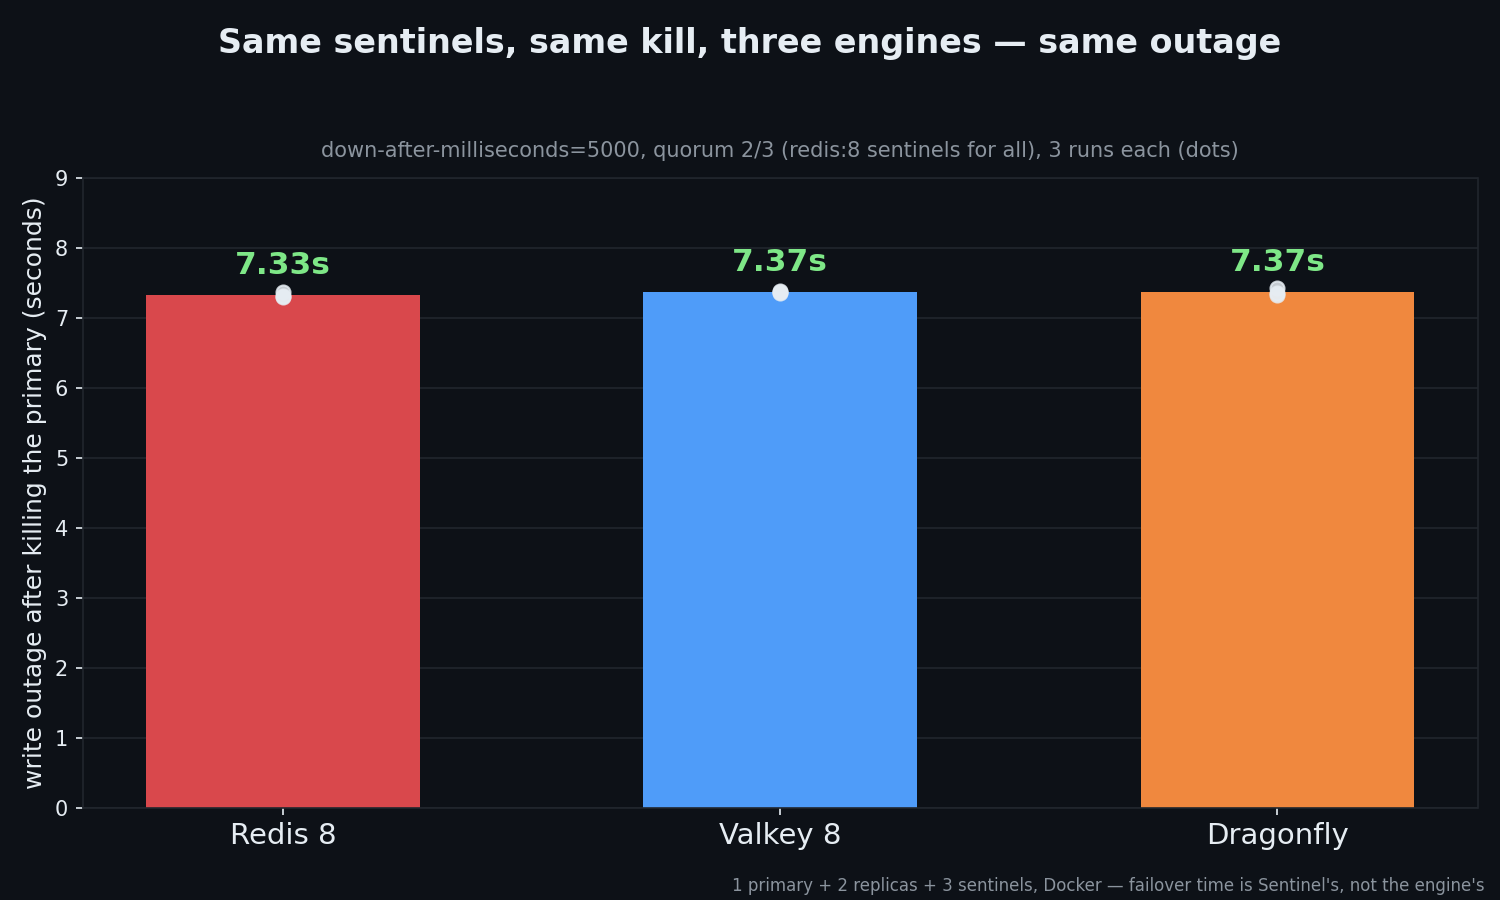
Fifteen kills across three engines, all within a tenth of a second of each other. Failover time is a property of Sentinel, not of the engine. Which makes sense once you've watched it happen: the window is detection silence (down-after) plus sentinel politics (quorum, leader election) plus one REPLICAOF NO ONE — the data engine is just the thing being pointed at. Switching to a faster engine won't buy back those seconds; tuning down-after will.
Two field notes from the non-Redis runs:
- Dragonfly's Sentinel compatibility is real. Unmodified Redis sentinels discovered the Dragonfly primary and replicas and ran the promotion with zero special configuration. The only friction: Dragonfly refuses to start with less than 256MiB of
maxmemoryper thread, so tiny lab configs need--maxmemoryraised accordingly. - Why Garnet isn't in this table: Microsoft's Garnet doesn't speak Sentinel — its HA story is its own cluster-mode replication. Timing that would be a different (interesting) experiment, not this one, and I'd rather leave a gap than publish an apples-to-oranges number. (Garnet's raw throughput, though, surprised me here.)
Wiring it to Laravel
The lab proves the infrastructure. The other half is making Laravel Sentinel-aware so it re-discovers the master after a failover instead of clinging to a dead IP. The Predis client supports this directly. In config/database.php:
'redis' => [
    'client' => 'predis',

    'default' => [
        // Point at the SENTINELS, not at a Redis master.
        'sentinel' => [
            'tcp://172.28.0.21:26379',
            'tcp://172.28.0.22:26379',
            'tcp://172.28.0.23:26379',
        ],
        'options' => [
            'replication' => 'sentinel',
            'service'     => 'mymaster',      // must match `sentinel monitor <name>`
            'parameters'  => [
                'password' => env('REDIS_PASSWORD'),
                'database' => 0,
            ],
        ],
    ],
],
Now Predis asks the sentinels who the master is and reconnects automatically when it changes. Point it at a fixed master IP instead and you've built all this machinery for nothing.
On phpredis: the C extension is faster and great for a plain single-node Redis, but it has no built-in Sentinel discovery — you'd implement the "ask a sentinel, then connect" dance yourself. If you want painless Sentinel support, Predis is the path of least resistance; if you're committed to phpredis, packages like Goopil/laravel-redis-sentinel wrap that dance for Laravel (including Horizon probes). Benchmark before assuming the client speed difference matters for your workload — for most apps it doesn't.
The traps nobody puts in the README
The demo is the easy 80%. These are the things that bite in production:
- Failover is not zero data loss. Replication is asynchronous. A write acknowledged by the old primary but not yet copied to the replica is gone when that replica is promoted. Sentinel picks the most up-to-date replica to minimise it, but the window is real. For a cache, fine. For anything you truly cannot lose, understand this before you rely on it.
- Tune
down-afterfor your reality — now with numbers. Your total outage isdown-after+ ~2s. Pick the largest value your SLO tolerates, because the price of going lower is false failovers: a stop-the-world GC pause or a 2-second network blip atdown-after=1striggers a needless promotion, and needless promotions are how you discover the data-loss window above. - Your queue and your cache should not share a failover group. Your cache wants an eviction policy (
allkeys-lru); your Horizon queue must usenoevictionor it will silently drop jobs when memory fills. Different criticality, different data-loss tolerance — run them as separate Redis instances, each with its own sentinels. - In-flight jobs during the window. Whatever a worker was mid-processing when Redis vanished may be retried after recovery. Make your jobs idempotent and set sensible retry/backoff. This is a feature (nothing is lost) only if your jobs can safely run twice.
- Quorum and placement. An odd number of sentinels (3 or 5), spread across separate failure domains — not all on the same host as the Redis nodes they watch. Two sentinels on the same box that dies is a quorum you can lose in one stroke.
- Enable persistence in production. I disabled it in the lab for clarity. In production, run AOF on at least the replicas so a promoted node comes up with data, not empty.
When Sentinel isn't enough
Sentinel gives you availability for a dataset that fits on one node. You've outgrown it when:
- Your data or write throughput is bigger than a single node can hold → Redis Cluster (sharding) — see what that costs operationally and what it does to your realistic throughput.
- You don't want to run, patch, and monitor sentinels yourself → managed (ElastiCache / managed Valkey) does exactly this failover for you. Now that you've built it by hand, you know precisely what that bill is buying: the on-call rotation for the bullet points above.
- You need multi-region survivability → that's a bigger conversation than Sentinel alone.
The takeaway
Adding app servers makes you feel highly available. Surviving the loss of your Redis node is what makes you highly available — and now you know exactly what it costs: down-after-milliseconds + ~2 seconds of write outage, measured, not guessed — and identical whether the node runs Redis, Valkey, or Dragonfly. Kill the primary yourself once — the lab is right here and takes five minutes. Seeing writes resume on a promoted replica, untouched by human hands, is worth more than any diagram.
Lab: Redis 8 / Valkey 8 / Dragonfly data nodes under redis:8 sentinels, Docker on macOS, 1 primary + 2 replicas + 3 sentinels, quorum 2, failover-timeout 10000. Outage = kill → first successful client write on the promoted node, via Sentinel discovery, 3 runs per setting and engine. Failover window and data-loss characteristics vary with replication lag and hardware — run it yourself and tune to your workload.
If you found this useful, the same measure-don't-guess approach applied to engine choice lives in my Dragonfly vs Redis vs Valkey benchmark series, with an interactive explorer for the raw data.
About the author
I'm Sunny Sahijwani — a senior backend & DevOps engineer.
👉 Connect with me on LinkedIn — I'm always happy to talk in-memory databases, performance, and systems architecture.
The full lab — docker-compose, kill scripts, the sweep, and raw CSVs — is public on GitHub — rerun it and tell me where I'm wrong.