
Part 2 of 7 · ← Methodology · Next: The cluster-saturation problem →

Part 2 of the series. Part 1 covered how I kept this fair. This post is the numbers — with the complete setup, every configuration, and every tweak I had to make, so you can reproduce or challenge all of it.
If you only remember one thing: there is no single "winner," and the shape of the answer is more useful than any single number. Same hardware, read-heavy pipelined load, 48 cores:
- 🐉 Dragonfly, one process: 15.5M ops/s
- 🔴 Redis Cluster, driven by a normal client: 4.6M ops/s
- 🔴 Redis Cluster, driven perfectly: 40.6M ops/s
All three are real, measured numbers. The rest of this post explains the setup that produced them and what they mean.
The exact setup (so you can reproduce it)
Hardware (AWS, us-east-1, single Availability Zone, cluster placement group, private network):
- Server (engine under test):
c7i.metal-24xl— bare metal, Intel Xeon Platinum 8488C (Sapphire Rapids), 48 physical cores / 96 threads, single NUMA node, 192 GB RAM. Bare metal specifically so CPU pinning is real and there's no hypervisor jitter. - Client (load generator):
c7i.24xlarge— 96 vCPU, on its own instance so it can never steal the server's CPU. I verified the client was never the bottleneck (more on that below).
Software (pinned by image digest for reproducibility):
- Redis 8.2.8, Valkey 8.1.9, Dragonfly v1.40.1, memtier_benchmark 2.5.1.
- OS: Amazon Linux 2023, kernel 6.18. Transparent huge pages disabled.
What I measured — three configurations, not two. This is the key methodological choice:
- Dragonfly — a single multi-threaded process (
--proactor_threads = N). - Redis/Valkey Cluster, "realistic" — an N-shard cluster driven by a normal client (memtier in cluster-mode): what a typical application actually experiences.
- Redis/Valkey Cluster, "fully-driven ceiling" — the same cluster, but with one dedicated memtier process per shard, each pinned to its shard via a hash-tag, so every shard is saturated: the cluster's raw hardware capacity if you route perfectly and throw unlimited client resources at it.
Why single-DF vs cluster (and not vs single Redis)? Because Redis executes commands on one thread. To use all 48 cores you must shard it into a cluster — so a single Dragonfly process (uses the whole box) vs an N-shard Redis cluster (uses the whole box) is the apples-to-apples comparison. Single-node Redis appears only as a labelled baseline.
Engine configuration (identical treatment, parity made explicit):
- Persistence off (
save "",appendonly no),maxmemorywell above the dataset,noeviction— set explicitly on all three (Dragonfly's--cache_mode=false --snapshot_cron='', verified from its docs, matches Redisnoeviction+ persistence-off). memlockunbounded on all engines (not just Dragonfly).- Cluster = one shard per physical core (I verified with a sweep that more shards didn't help — see Part 3).
Workload (memtier, client-side latency — never the engine's self-reported info):
- GET/SET ratios 10:1 (read-heavy) and 1:1 (mixed); value sizes 100 B and 1 KB; pipeline depth 1 and 16.
- 1M-key keyspace, pre-populated so every read hits real data (I checked — hit rate was 1.0 on every run; an un-populated benchmark measures the cheap "key not found" path).
- 2 repetitions per cell, median reported — except the fully-driven ceiling series, which is a single run per cell. Its shape reproduces across all five core counts, but treat its exact figures as less firm than the rest.
The tweaks I had to make (and why they matter)
Being honest about these is the whole point — each one changes the numbers, and skipping any of them would have produced a misleading result:
- Dragonfly needs io_uring — and Docker blocks it by default. On a fresh AL2023 box, Dragonfly silently fell back to
epoll(its slower path) because Docker's default seccomp profile blocks the io_uring syscalls. Running Dragonfly on epoll would have unfairly handicapped it. Fix:--security-opt seccomp=unconfinedso it uses io_uring — its native I/O. Redis/Valkey use epoll natively, so each engine runs on its own best path. - Dragonfly needs
maxmemory ≥ ~256 MB × threads(12 GB at 48 threads). I gave it 32 GB. - The client has to be big. My first cluster runs were quietly limited by too few client threads. It took 48 client threads to saturate the server — and I confirmed at peak load the server sat at ~100% CPU while the client had ~78% headroom. If the client is the bottleneck, every engine flatlines at the client's limit and the benchmark is worthless.
- Driving a cluster to its real throughput is genuinely hard — hard enough that it's its own post. It's why there are two cluster numbers, not one.
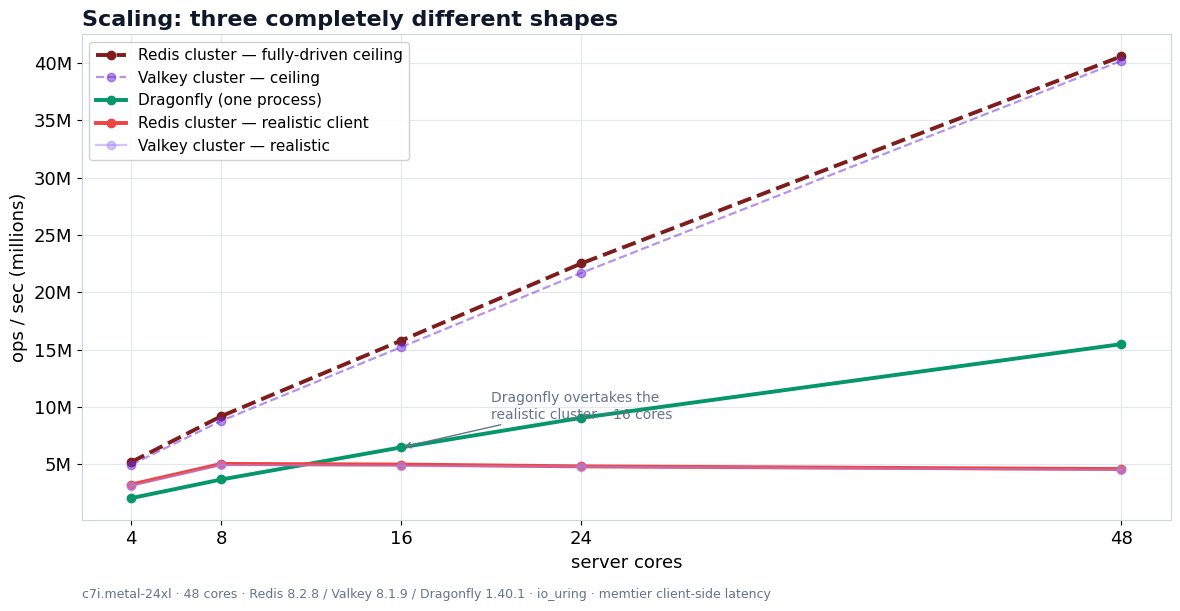
Scaling: throughput vs cores (read-heavy, 100 B, pipeline 16)
This is the chart that tells the story. Throughput in millions of ops/sec, as the server's core count grows 4 → 48:
| cores | Dragonfly | Redis realistic | Redis ceiling | Valkey realistic | Valkey ceiling |
|---|---|---|---|---|---|
| 4 | 2.0 | 3.2 | 5.2 | 3.1 | 5.0 |
| 8 | 3.7 | 5.0 | 9.2 | 4.9 | 8.8 |
| 16 | 6.5 | 5.0 | 15.8 | 4.9 | 15.2 |
| 24 | 9.0 | 4.8 | 22.5 | 4.8 | 21.7 |
| 48 | 15.5 | 4.6 | 40.6 | 4.5 | 40.2 |
Three completely different shapes:
- Dragonfly scales smoothly, 2M → 15.5M. One process, one connection endpoint, a dumb client — and it just keeps climbing with cores.
- The realistic cluster plateaus at ~5M around 8 shards and then goes flat — even slightly down. Adding shards past 8 doesn't help a normal client at all, because the client spends more and more effort routing keys across more and more shards. This surprised me, and it's the single most important practical finding: throwing more shards at a normal cluster client does not buy you throughput.
- The ceiling scales hard, 5M → 40.6M — because the underlying hardware (48 single-threaded shards, each doing ~850K ops/s) genuinely can do that much. You just have to route perfectly to reach it.
Dragonfly overtakes the realistic cluster at ~16 cores and finishes 3.4× ahead at 48 (15.5M vs 4.6M). It reaches 38% of the raw ceiling — with a one-line client. Redis/Valkey are near-identical throughout (Valkey is the Redis fork; no surprise).
What each number is for
- If you deploy a cluster and use a normal client (the overwhelmingly common case): you get ~4.6M, and Dragonfly gives you 3.4× that for a fraction of the operational effort.
- If you can invest in flawless client-side routing and a client as powerful as your server: the cluster's ceiling (40.6M) beats Dragonfly (15.5M) by 2.6×. That's real — but it's a lot of "if."
- Dragonfly's pitch, quantified: most of the cluster's throughput, for almost none of the cluster's operational cost.
Two honest wrinkles
Big values are network-bound. At 1 KB values (read-heavy, pipeline 16, 48 cores), everything compresses: Dragonfly 4.8M, realistic cluster 3.7M, ceiling 7.7M. Once each op moves ~1 KB, you're bandwidth-limited, not engine-limited, and the gaps shrink. Pick the value size that matches your workload.
Without pipelining, nobody is fast (it's a round-trip-bound world): read-heavy, pipeline 1, 48 cores — Dragonfly 2.8M, realistic cluster 1.4M. Dragonfly still leads, but this is the regime where your network RTT dominates, not the engine.
Next
Part 3 is the one I find most interesting: why a normal client only gets 4.6M out of a cluster that can do 40M — and what that says about benchmarking (and operating) Redis Cluster at scale. Then latency, memory, and the operational-simplicity tax.
Everything here — scripts, pinned versions, raw runs.csv, the analysis — is public so you can rerun it. Verified against DragonflyDB founder Oded Poncz's benchmarking notes before publishing; the fairness choices (and the bias I caught in my own setup) are in Part 1.
About the author
I'm Sunny Sahijwani — a senior backend & DevOps engineer.
👉 Connect with me on LinkedIn — I'm always happy to talk in-memory databases, performance, and systems architecture.
The full harness, pinned versions, and raw data for this benchmark are public on GitHub — rerun it and tell me where I'm wrong.