
Part 4 of 7 · ← The cluster-saturation problem · Next: Memory efficiency →

Part 4. Throughput (Part 2) tells you how much work gets done; latency tells you how it feels. On this benchmark they turn out to be the same story — and the "realistic cluster" numbers need careful, honest reading.
All numbers below are client-side latency from memtier (never the engine's self-reported info — Dragonfly counts network+queue time there and Redis doesn't, so those aren't comparable). Read-heavy, 100 B, 48 cores.
Without pipelining (depth 1) — concurrency only
| series | p50 | p99 | p99.9 |
|---|---|---|---|
| Dragonfly | 0.34 ms | 0.55 ms | 0.71 ms |
| Redis cluster (realistic) | 10.4 ms | 19.2 ms | 30.1 ms |
| Valkey cluster (realistic) | 10.4 ms | 18.5 ms | 29.1 ms |
With pipelining (depth 16) — throughput regime
| series | p50 | p99 | p99.9 |
|---|---|---|---|
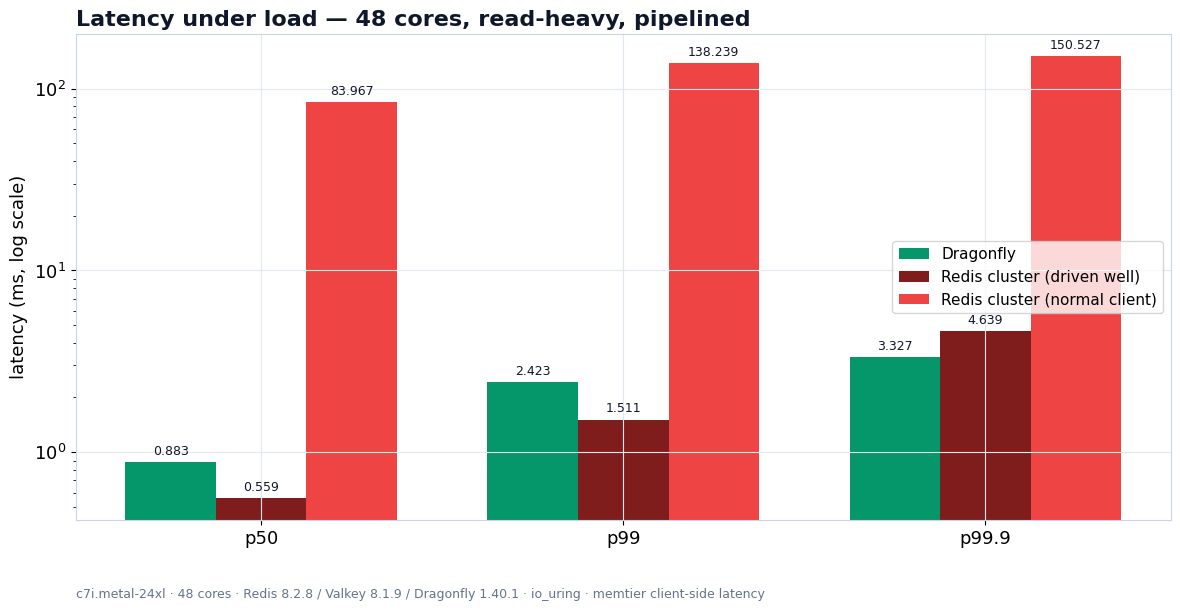
| Dragonfly | 0.88 ms | 2.42 ms | 3.33 ms |
| Redis cluster — fully driven | 0.56 ms | 1.51 ms | 4.64 ms |
| Valkey cluster — fully driven | 0.57 ms | 1.32 ms | 3.50 ms |
| Redis cluster — realistic | 84 ms | 138 ms | 151 ms |
| Valkey cluster — realistic | 86 ms | 141 ms | 158 ms |
Reading this honestly
Three things, and the third is the one people will (fairly) push on:
-
Dragonfly is consistently sub-millisecond — 0.34 ms unpipelined, 0.88 ms under a heavy pipelined load. One endpoint, no client-side routing, predictable tail.
-
A well-driven cluster has excellent latency too — the fully-driven shards actually beat Dragonfly at the median (0.56 ms), because each shard gets a clean, dedicated, fully-pipelined stream. So the shards themselves are fast. When Redis Cluster is driven right, its latency is great.
-
The "realistic cluster" latency explodes — 84 ms p50 — and that's a client-side effect, not the shards. This is the same bottleneck from Part 3: a single cluster-mode client can't route to 48 shards fast enough, so requests queue up on the client waiting to be sent. That queuing shows up as latency. It is not the cluster's servers being slow — driven well, the same shards do 0.56 ms.
So I won't claim "Redis Cluster has 84 ms latency" — that would be dishonest. What I will claim, because it's what the data shows: a normal single-process cluster client, under load heavy enough to matter, degrades in both throughput and tail latency at the same time — and you feel it as multi-hundred-millisecond p99s. Fixing it means the client-side engineering from Part 3.
The takeaway
Latency here isn't a separate axis — it's throughput viewed from the other side. Where the client can keep up (Dragonfly always; a cluster only with per-shard routing + enough client capacity), latency is sub-millisecond and tight. Where the client is the bottleneck (a naive cluster client), latency and throughput fail together. Dragonfly's value is that "the client keeps up" is the default, not something you engineer.
Next: Part 5 — memory efficiency, the least-disputable number in the whole series.
About the author
I'm Sunny Sahijwani — a senior backend & DevOps engineer.
👉 Connect with me on LinkedIn — I'm always happy to talk in-memory databases, performance, and systems architecture.
The full harness, pinned versions, and raw data for this benchmark are public on GitHub — rerun it and tell me where I'm wrong.